See The Data In Action
We believe in transparency. Below are examples of real deliverables we have generated for municipal clients. This is the level of detail you can expect.
City-Wide Trip Hazard Inventory
The Challenge
The city needed a systematic way to identify trip hazards to prioritize grinding and replacement projects. They required a format that could easily import into their existing GIS viewer.
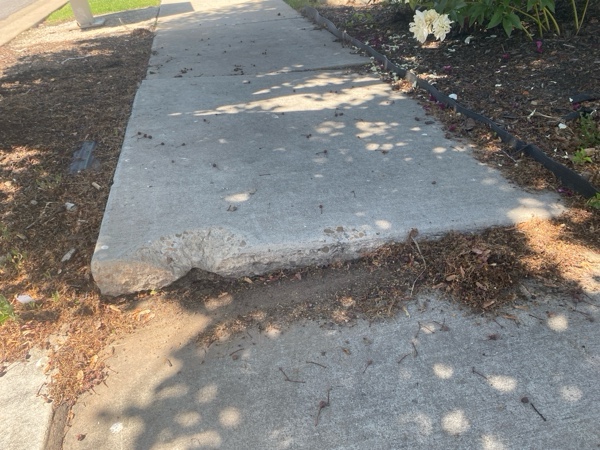
The Solution
QJF deployed field teams to walk the designated sectors. We identified hazards, classified them by severity (Low/Medium/High), and noted specific causes such as tree roots.
- CSV Database with GPS Lat/Long
- High-Resolution Photo Links
- Severity & Cause Classification
Data Snapshot (Sanitized)
| GPS Coordinates | Severity | Address | Evidence |
|---|---|---|---|
| 40.516, -111.417 | High (Tree Root) | 235 W 650 N | [JPG] |
| 40.515, -111.416 | Medium (Lifted Panel) | 598 N 200 W | [JPG] |
| 40.505, -111.398 | Low (Minor Settling) | 960 E 200 S | [JPG] |
| 40.504, -111.397 | High (Expansion Heave) | 234 S 1000 E | [JPG] |
| 40.512, -111.405 | Extreme (Severe Buckling) | 450 S Main St | [JPG] |
| 40.508, -111.410 | Severe (Spalling) | 120 E 100 S | [JPG] |
Want to see a sample from your city?
We can perform a small "Pilot Audit" of a few blocks to demonstrate the value.
Request a Pilot